 Coachigo
Progress and stats
How plateau alerts work in Coachigo
When an exercise gets flagged, how trend and severity are calculated, and where to see alerts: everything about plateau alerts in Coachigo.
Coachigo keeps an eye on every exercise your clients do and lets you know when one stops improving, or starts going backward. That way you catch a plateau before your client gets bored of it, and you know when it’s time to change the stimulus.
When is an exercise analyzed?
Coachigo only analyzes an exercise with enough history behind it. It needs:
- at least 6 sessions with a checked set on that exercise;
- at least 8 weeks between the first and the last one;
- at least one session in the last 3 weeks, and at least one in the 3 weeks before that;
- an existing record on the exercise (see how records are calculated).
So a brand-new exercise, or one that’s been set aside for a while, never gets flagged.
The trend
For each session, Coachigo keeps the exercise’s best estimated 1RM. It then averages the last 3 weeks and compares that with the 3 weeks before:
- above +2%: the exercise is improving;
- between −5% and +2%: it’s stalling;
- below −5%: it’s declining.
Severity
Severity depends on how long ago the last record was set:
- Mild: less than 3 weeks;
- Moderate: 3 to 6 weeks;
- Severe: 6 weeks or more.
An exercise that’s improving with a record less than 3 weeks old is never flagged. If its record is 3 weeks old or more, it gets flagged even while improving. A stalling exercise, on the other hand, stays flagged right after a record: it then shows up as Mild.
Here, matching a record counts as a new one: the day counter starts over.
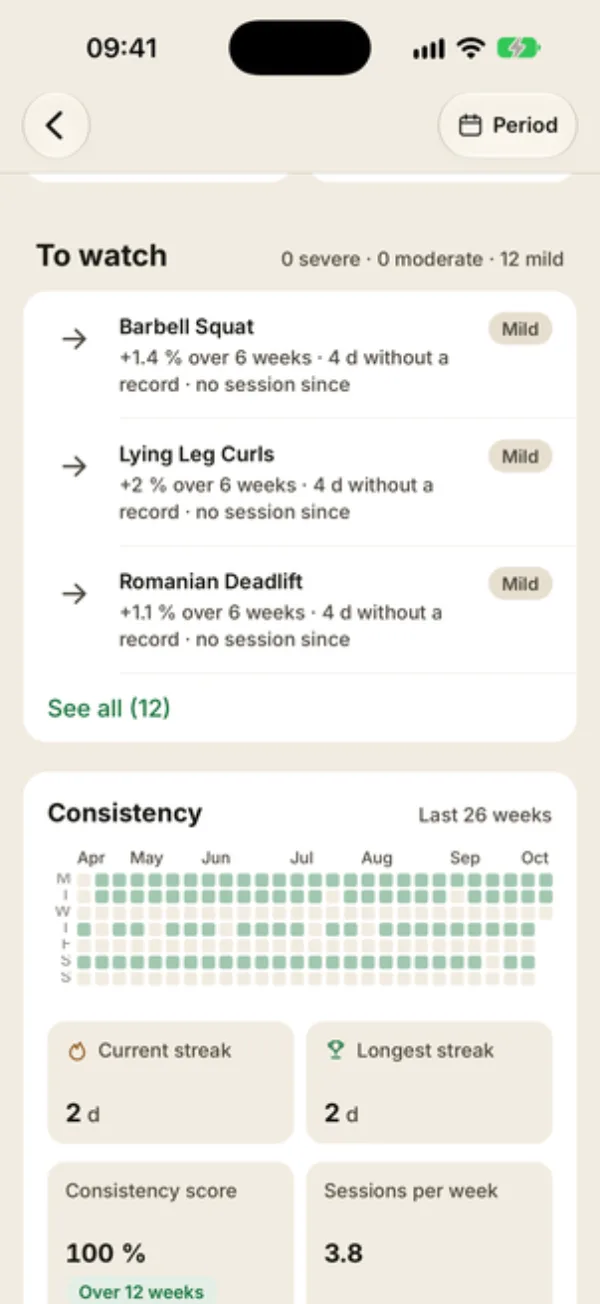
In statistics: To watch
In the client’s Detailed statistics, the To watch section sums up the alerts, like “0 severe · 0 moderate · 12 mild”. The most severe come first; the top 3 are shown, and See all expands the list. The rows don’t open anything: to dig in, use Progress by exercise further down.
Each row shows:
- the trend as a percentage, like “+2 % over 6 weeks”: that’s the gap between the last 3 weeks and the 3 weeks before;
- the number of days since the last record;
- the number of sessions done since that record (“no session since” if it came from the latest one).
The section follows the range picked at the top of the screen: with 7 d or 30 d, there’s never enough history, so it doesn’t show up. Stick with 90 d or All.
On the client profile: Key points
On the client’s profile, the Key points block shows the most severe alert as “Plateau:” followed by the exercise. A mild alert only shows up there if the exercise is declining. The detail line says why:
- “Average 1RM down X % over 3 weeks” if the exercise is going backward. It’s the same calculation as the “over 6 weeks” percentage in To watch;
- otherwise “No record in the last N sessions”;
- or “No record for N weeks”.
This block covers the client’s whole history, with no range filter. Tap the row to open the exercise’s statistics. See also reading a client profile.
Check the chart
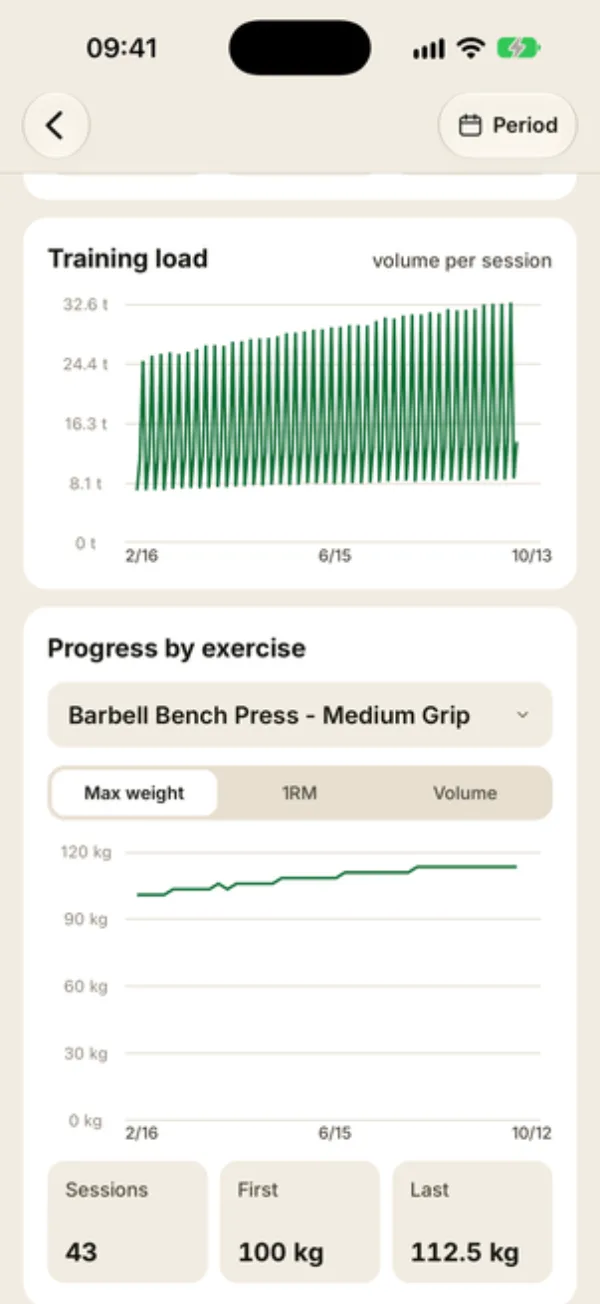
Before changing the program, look at the chart: in Progress by exercise, pick the exercise and the 1RM tab. A plateau jumps out right away, and you can tell a real drop from a single off day. Exercise statistics go even deeper.
FAQ
Why is a bodyweight exercise flagged when my client is improving?
With no weight, there’s no estimated 1RM: the trend stays at 0%, the exercise is always rated as stalling, and the severity only reflects the time since the last rep record. Check Max reps in the exercise’s statistics.
Can I dismiss an alert?
No. An alert clears on its own once the exercise sets a new record and trends upward again (above +2%), or once it hasn’t been done for 3 weeks.
What should I do about a severe alert?
It’s a signal, not a diagnosis. Look at readiness and perceived effort over the last few sessions (see readiness and RPE insights), then adjust volume, intensity or the exercise variation.