 Coachigo
Progress and stats
How to read readiness and RPE insights in Coachigo
Check-in averages, an 8-week readiness and RPE chart, sleep impact: how to read the Readiness and RPE card in a client's statistics in Coachigo.
The Readiness and RPE card brings together two things your client reports themselves: how they feel before a session and how hard it felt at the end. It helps you see whether fatigue is building up, and whether poor sleep is weighing on their training.
Where the data comes from
- The readiness check-in, when a session starts from a workout template or a program (“How are you feeling?”): Sleep, Muscle freshness, Motivation and Stress, each rated 1 to 5. The Overall score is their average. See the readiness check-in.
- RPE, at the end of the session (“How was it?”): a rating from 1 (Very easy) to 10 (Max effort). See logging session RPE.
If your client taps Skip, nothing is saved for that session. The more often they fill in both, the more useful the card gets.
Averages and the chart
The card sits in the client’s Detailed statistics. It shows up as soon as there’s at least one check-in in the last 8 weeks (and in the selected range).
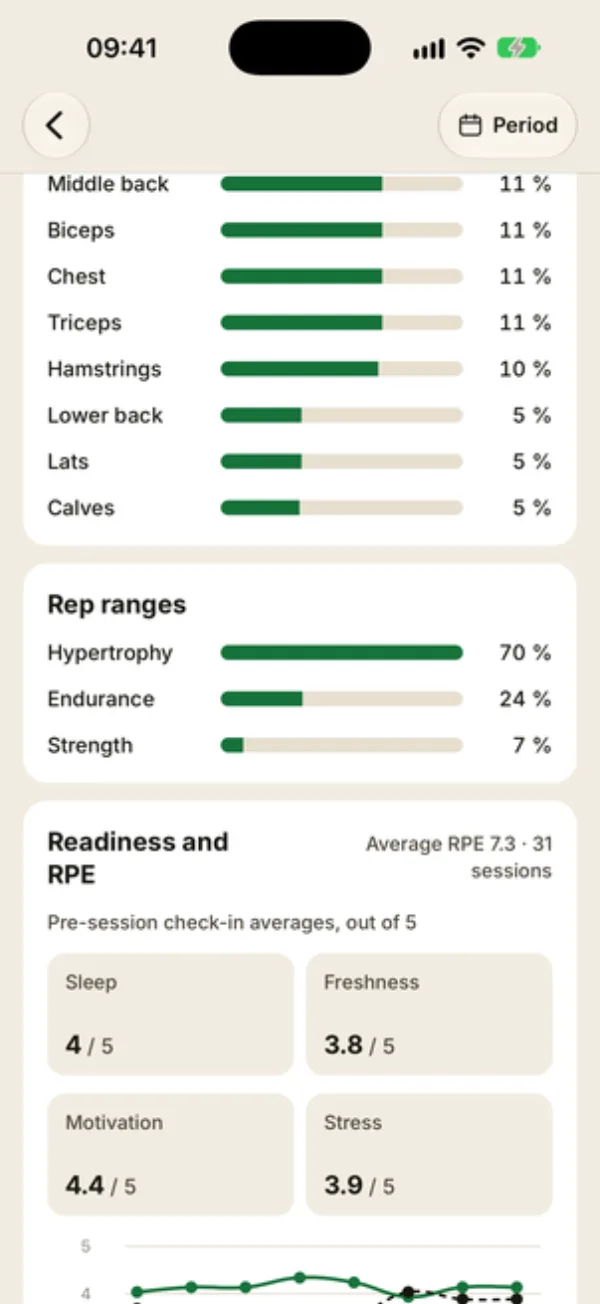
- At the top right, Average RPE and the number of rated sessions, once there are 5 sessions with an RPE.
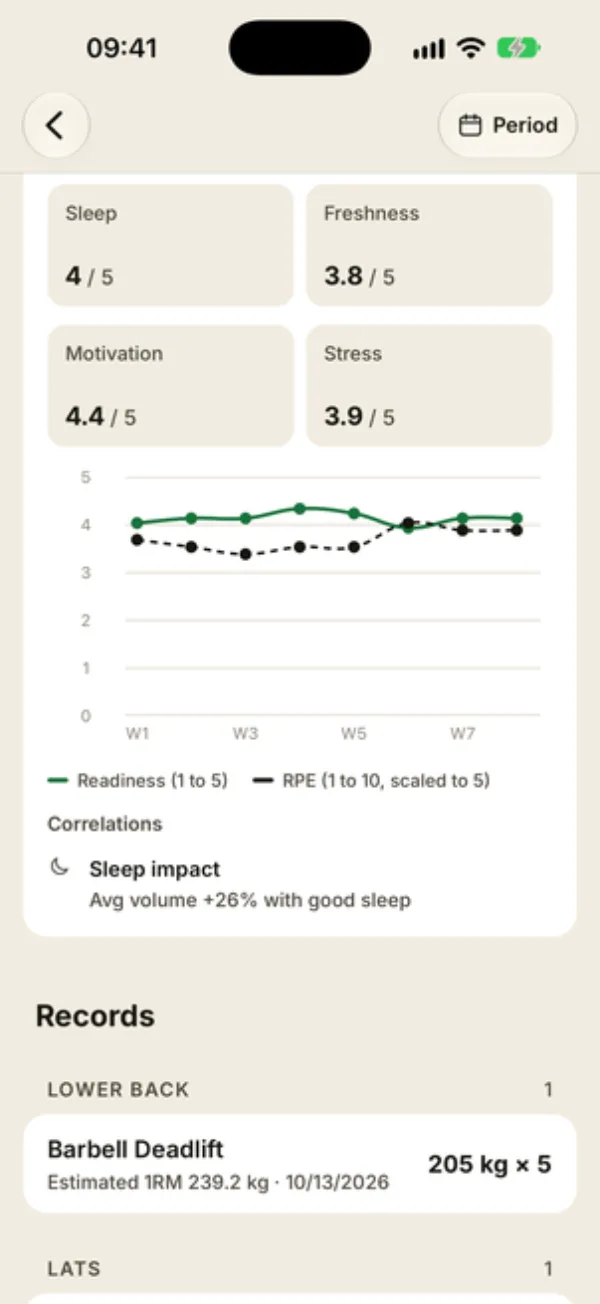
- The four tiles (Sleep, Freshness, Motivation, Stress) give the Pre-session check-in averages, out of 5, over the selected range. For stress, 5 means “Zen”, so a high number is a good sign, just like the other three.
- The chart covers the last 8 weeks: Readiness (1 to 5) as a solid line, and RPE (1 to 10, scaled to 5) dotted, halved so it fits the same scale. It only uses sessions with a check-in: RPE from a session without one doesn’t appear, and a week with no check-in drops to 0.
Reading the chart
- Readiness drops, RPE climbs: sessions feel harder while your client shows up less fresh. That’s often a sign fatigue is setting in.
- Both stay steady: your client is handling the load well.
- RPE drops at the same weights: your client has room to progress.
Cross-check with plateau alerts: a plateau with falling readiness usually calls for a lighter week rather than more weight.
Correlations
Under the chart, Correlations compares average session volume depending on how your client felt. Despite the name, this isn’t a statistical calculation: Coachigo simply averages the volume of two groups of sessions and shows the gap.
- High or low readiness: “Average volume +X% when readiness is high”. Sessions with an overall score of 4 or more are compared with those at 2 or less.
- Sleep impact: “Avg volume +X% with good sleep”. Sessions with sleep rated 4 or 5 are compared with those rated 1 or 2.
It takes at least 10 sessions with a check-in in the range, plus sessions in both groups. Since ratings of 2 or less are rare, one line, or both, may be missing.
A clue, not proof
Volume also depends on the session itself: leg day weighs more than arm day. A +26% gap is a good way into a conversation about sleep with your client, not a conclusion.
FAQ
Why doesn’t the Readiness and RPE card show up?
It needs at least one check-in in the last 8 weeks. If your client always skips the check-in, or only does freestyle sessions (where the check-in doesn’t appear), the card stays hidden.
Why isn’t the average RPE showing?
It needs at least 5 sessions with an RPE in the selected range. Try All or 90 d.
Why does the chart drop to 0 some weeks?
A week with no check-in is plotted at 0, for both readiness and RPE, even if RPE was logged. It’s not a rating, just a week with no check-in.