 Coachigo
Programs
How to read a program's statistics in Coachigo
Overall progress, sessions per phase, volume since the start and adherence: what a program's statistics show in Coachigo and how to read them.
A program’s statistics show, for one client, whether they’re keeping pace, how their sessions spread across phases and how their training volume is trending.
Open the statistics
Open the client’s program progress (Manage on their profile), then tap the chart icon at the top right. From the client’s statistics, the Active program card leads to the same screen.
Pick the time range at the top: 7 d, 30 d, 90 d or All (the default), or a custom range with Period. It filters the sessions counted, not the sessions planned.
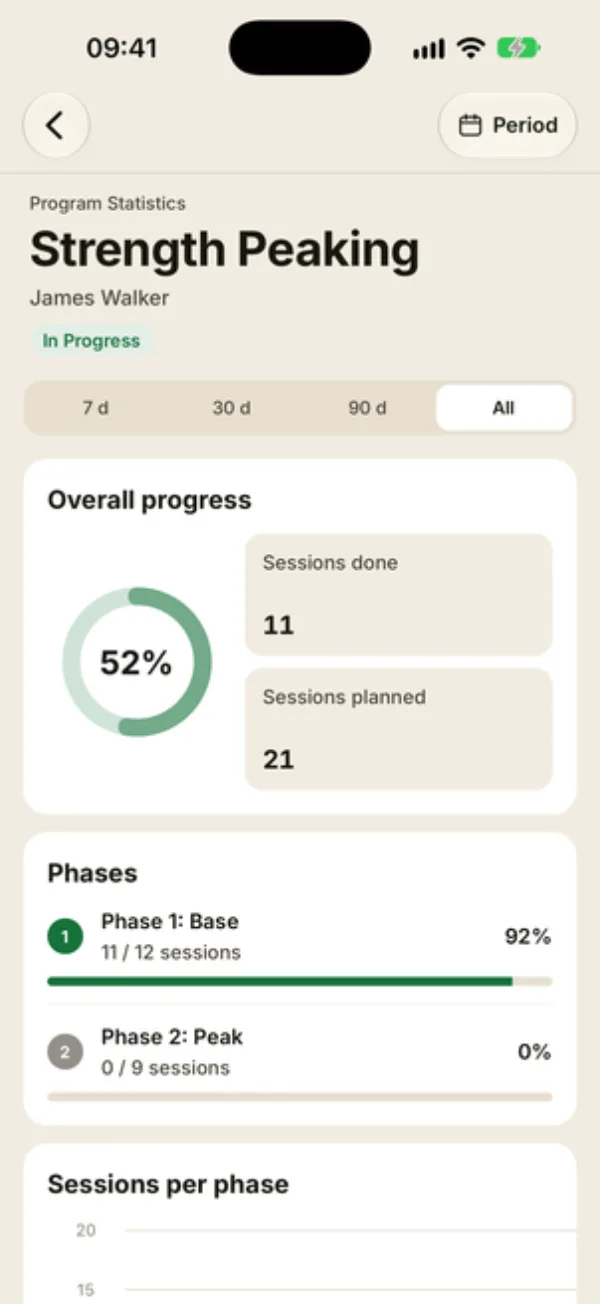
Overall progress and phases
- Overall progress: sessions done as a share of sessions planned.
- Sessions done: the client’s sessions logged with this program in the selected range, including any from an earlier assignment of the same program.
- Sessions planned: the program total, that is each phase’s sessions times its duration.
- Phases: for each phase, sessions done out of sessions planned, and the percentage.
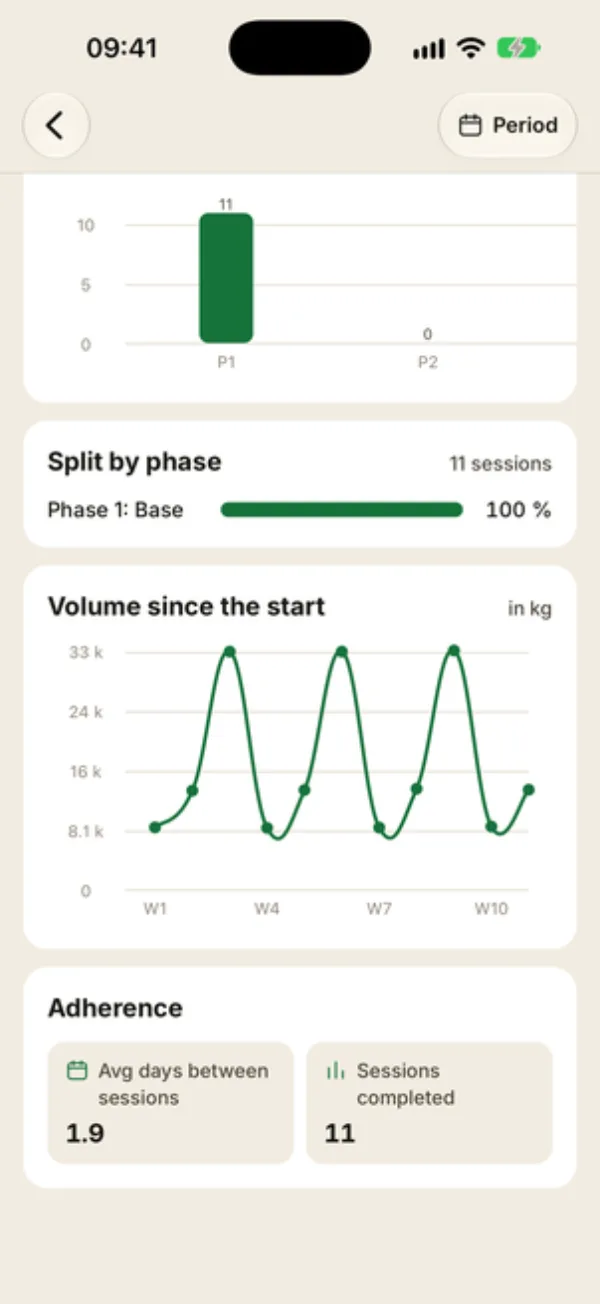
Split, volume and adherence
- Sessions per phase: a bar chart, shown when the program has at least two phases.
- Split by phase: the share of sessions done in each phase, shown from the first session on.
- Volume since the start: the volume lifted (weight × reps of checked sets, excluding bodyweight and timed exercises) in each program session, from three sessions on. Each point is one session, even though the axis numbers them W1, W2…
- Adherence: Avg days between sessions, the average gap between two program sessions (0 until there are two), and Sessions completed, the same number as Sessions done.
Spot a client who's slipping
A growing gap between sessions is often the first sign that motivation is dropping. Compare it with the planned pace: a 3-sessions-a-week program should come out around 2 days apart.
FAQ
Why 52% here but 38% on the progress screen?
Statistics count the sessions logged with this program in the selected range. Progress is based on where your client is in the program. The two can differ, for example if you picked a range shorter than All, if the client already ran this program once before, or if a session was edited afterward.
Are there statistics across all clients of a program?
Not as charts. On the program screen, the Clients section shows each client’s progress, and each day shows how many times it’s been done by clients who are following or finished the program. Tap a day to open Completion history: who did it, when, and how many sets.
The volume chart is empty
It shows up from three program sessions on. Below that, there aren’t enough points for a curve.